Like a lot of things I write, this post is motivated by my own past mistakes. I’ve worked on a lot of Rust projects over the last five years. Along the way, I’ve had the opportunity to work with many extremely talented Rust developers, and get a deep look into the Rust Ethereum ecosystem. At this point, if you are using Ethereum, you likely use or rely on my work.
I am self-taught. I think this is true for many Rust Ethereum developers. I have a bachelor’s in Japanese and no experience with software development in large companies. I’ve never had a Rust mentor or teacher, although I’ve learned an incredible amount from my peers and collaborators. Being self-taught comes with some baggage, of course. We don’t have the same exposure to the tools and best-practices that are common in enterprises, and we tend not to have experience operating large-scale systems.
As part of the work we’re doing at init4 on Signet, we started deploying a lot of systems, and investing heavily in observability. While doing that, I discovered all the mistakes we made while writing alloy, and (as I do) formed some strong opinions about tracing. Hopefully by writing them down, I can save everyone else a bit of time and a lot of headaches.
Tracing vs Logging
So first of all, what is tracing? “Tracing” is best understood as a way of recording information about a program’s execution, in a structured way. It is an evolution of, and improvement on, traditional logging.
Developers are familiar with logging. We’re used to console debugging like println!("what the heck is {}, {}", x, y); and logging is a natural extension of that. We add log lines to our code, and then we can see what happened when we ran the program. This works great for individuals, or in small programs, but it doesn’t scale well to large systems.
There are a few problems that prevent logging from scaling up. The most annoying for me are the following:
- Logs are discrete, while systems are continuous.
- Logs are localized, while systems are distributed.
- Log data is text, while system data is structured.
- Logs are isolated, while system events are related.
So what do these mean?
Logs are discrete, while systems are continuous
A program runs continuously, and we want to understand what it is doing over time. Logs are discrete events, and we have to infer the program’s behavior from a series of log lines. This is hard, and often impossible. To correct this, tracing’s core primitive is not the event, but the span. A span represents a unit of work, and has a start and end time. Spans can be nested, and we can see the relationships between spans. This gives us a much richer understanding of what the program is doing.
Logs are isolated, while system events are related
Logs are just a series of unrelated events, and a reader has to infer the relationships between them. Tracing spans are nested by default, and events are associated with a specific set of spans. This makes it much easier to understand the relationships between events. Filtering events by the span that contains them is a powerful way to understand the behavior of a system.
Logs are localized, while systems are distributed
Logs are generated by a single program, and localized to the machine that the program is running on. In a distributed system, we have many programs running on many machines, and we want to understand how they interact. Tracing standards allow correlation of events across service boundaries(!!!). E.g. the traceparent header standard allows correlation of events between different system components communicating over HTTP. Properly-instrumented systems can be traced end-to-end, even when they are distributed across many services.
Log data is text, while system data is structured
Logs are just text, and we have to parse them to extract useful information. This is hard, and often impossible. Tracing data is structured, and we can attach arbitrary key-value pairs to spans and events. This makes it much easier to extract useful information. Structured data allows consumers to filter, aggregate, and analyze the data in powerful ways.
If we can stop thinking of tracing as “better logging”, and start thinking of it as critical infrastructure for understanding complex systems, our software will be more maintainable, more mature, and more ready for institutional use.
Thinking about tracing
Our goal is to implement good tracing, and then to configure our program to output traces in useful ways. These ways may include logging, but tracing is distinct from and more important than logging. When we trace a program well, we get informative logging for free, in addition to powerful visualizations, performance information, and a suite of industry-standard telemetry tools. In order to that, we have to update our mental model from logging to tracing.
The core primitive of a tracing is the span. Spans represent a timed portion of program execution, and contain metadata about the work being done. E.g. a span may represent a single HTTP request, and contain the HTTP Method, the route, and the length of the body in bytes. Spans should be:
- time-limited—at most a few seconds.
- work-associated—a specific action the program is taking.
- informative—have useful data attached to them, and not over-verbose.
Spans are hierarchical. This means that spans may have a parent, siblings, children, etc. When your traces are exported, you can explore relationships between spans. A common mistake we make is thinking of tracing as oriented towards events. Unlike spans, events are easy to see and think about. An event corresponds to a single logical line of code.
Events represent a single point in time. They are associated with the currently-open span tree. We often think of events as log lines, but it’s better to think of them as a notable point in time that we might be interested in. Whether this results in a log line or not is a separate point of configuration.
As developers, we tend to focus on events because they are easier to understand. They correspond nicely to console-output debugging, which is the friendliest most comforting tool a developer has. However, events do not help in understanding the flow of execution. They leave huge gaps that spans cover. Events without spans are not useful. Observability exists to answer complex questions. When tracing a distributed system we’re not trying to figure out if a bus stopped at your street. We want to know where it is on its route, how it got there, and what the average time between stops is. Spans cover this data, while events don’t.
Events are an important part of your instrumentation. We use them to know whether critical sections have been passed, and what the state of the system was at that point in time. To make them useful, events should be:
- informative—have useful data attached to them, and not over-verbose.
- descriptive—the message should be clear and concise.
- lifecycle-aware—events should be used to record the lifecycle of a unit of work.
- non-repetitive—the event should fire ONCE in its span’s lifetime.
Distributed Tracing
The goal of instrumenting code is to allow us to observe its behavior both in specific instances, and in aggregate. We want to be able to see how it behaved in a specific run, and we want to be able to see how it behaves across many runs. In other words, just creating the span data is not enough. We need to observe it. This requires not only development, but operations. I’ll avoid going in depth on this, but expect a followup post. Developers need to understand two main things: Distributed Tracing as a concept and OpenTelemetry.
The core idea of distributed tracing is that systems are not isolated programs. They are complex sets of microservices or components, and data may move across many of them as part of a logical task. Distributed tracing systems therefore need to collect traces from several different places, aggregate the information, correlate the traces (e.g. by creating span hierarchies that include spans from different programs running on different machines), and expose them to queries. An entire industry of tools like Honeycomb and Groundcover (init4’s current preferred provider) have sprung up, in addition to open-source tooling like Jaeger and Zipkin.
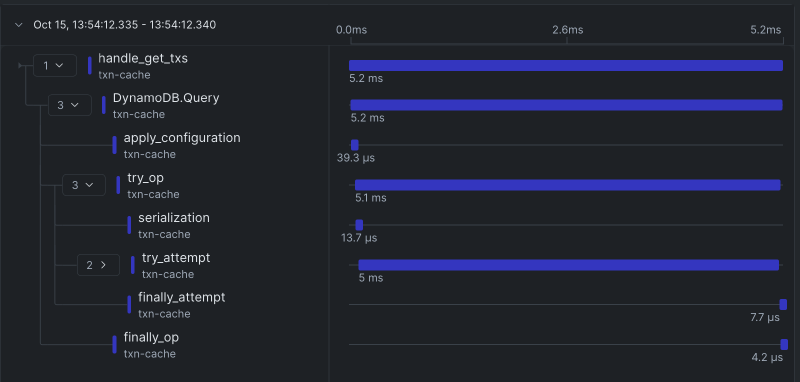
Here’s a pretty simple span trace from our Groundcover setup:
In order to move traces from your components to your distributed tracing provider, you need a standard serialization of trace data. The industry has largely settled on OpenTelemetry. OpenTelemetry (OTEL) provides a set of standards for creating and maintaining traces, as well as the OpenTelemetry Protocol (OTLP) for sending trace data over a network. OpenTelemetry provides a set of semantic conventions to standardize trace contents over broad ranges of application types. E.g. ajj implements the semantic conventions for a JSON-RPC server. Rust has good libraries for OpenTelemetry, and integrations between OTEL, OTLP, and the tokio tracing ecosystem.
Back to Crypto
So back to my past mistakes. I’ve written a lot of code that treats tracing as logging, and I’ve approved a lot of PRs that do the same. This code is ubiquitous in the ecosystem. I did this because I did not understand tracing. I’m writing this because I now believe that distributed tracing ought to be mandatory for production software. Until our clients, libraries, etc have strong span-oriented instrumentation, they are not ready for institutional deployment. All software is work-in-progress, crypto software doubly so. You do not have to ship with a perfectly instrumented codebase. We can improve our code over time, span by span.
At this point, if you want some hands-on content, check out our teaching-tracing repo. Which contains all the code you need to create and instrument binaries, as well as bad examples, gotchas, and a bunch of very legible documentation. Reach out to us on twitter if this was helpful 🙂